


Illustration by Pawel Kuczynski
Summary
- Governments have spent over $20 billion – and have approved up to $200 billion more – of public money on carbon capture and storage (CCS), providing a lifeline for the fossil fuel industry.
- 79% of operating carbon capture capacity globally sends captured CO2 to produce more oil (via Enhanced Oil Recovery).
- Many of the largest CCS projects in the world overpromise and under-deliver, operating far below capacity.
Carbon, Capture, Utilization, and Storage (CCS or CCUS) has a 50-year history of failure. CCS is often presented as a new technology to reduce carbon dioxide (CO2) emissions by trapping CO2 from a smokestack or directly from the air and then injecting it into the ground for storage. In fact, CCS was first developed in the 1970s to enhance oil production, and increased oil production remains its primary use. Oil Change International research finds that 79% of operating carbon capture capacity globally sends captured CO2 to produce more oil (via Enhanced Oil Recovery).
The story of CCS as a method to reduce CO2 emissions is one of overpromising and under-delivering. Analysis after analysis has concluded that CCS is not a climate solution. In September 2023, the International Energy Agency noted that: “The history of CCUS has largely been one of “underperformance” and “unmet expectations.”
Yet Big Oil consistently tells us that CCS is central to the fight against climate change. Chevron, for example, says that CCS will make a “lower carbon future possible.”
In the run-up to COP28 in the United Arab Emirates, the oil industry and many governments are ramping up their promotion of CCS as an integral part of the collective response to climate change. There has been a flurry of renewed government commitments, conferences, and new industry initiatives, coupled with continuing misinformation. Governments around the world have spent over $20 billion – and have approved up to $200 billion more – of public money on CCS, providing a lifeline for the fossil fuel industry.
In October 2023, ADNOC, the Abu Dhabi National Oil Company, whose CEO, Sultan Al Jaber, is the COP28 President, announced that it planned to double its CCS capacity to 10 million tonnes per year. But ADNOC’s existing flagship CCS project, which is supposed to capture emissions from a steel plant, is only designed to capture around 17% of that plant’s maximum CO2 pollution. Furthermore, there is no publicly available information about how much CO2 it has actually captured. What the CCS project does capture is used to increase oil production, leading to more emissions when burned.
As governments prepare to spend up to $200 million of public money on CCS, it must be clear: CCS is a lifeline for the fossil fuel industry, not people and planet.
Subsidies
Governments have spent over $20 billion – and have legislated or announced policies that could spend up to $200 billion more – of public money on CCS, providing a lifeline for the fossil fuel industry.
Key facts
- Ten governments have already spent at least $21 billion on CCS and Fossil-Hydrogen.
- This number is likely very conservative due to a shocking lack of transparency on government subsidies and tax credits.
- Twelve governments have approved policies that could funnel up to $200 billion more toward CCS and Hydrogen.
Read our full analysis.
Despite appalling performance, governments are preparing to shovel hundreds of billions of dollars of taxpayer money into more CCS.
We have tracked over $21 billion in grants and loans to carbon capture and related hydrogen projects to date. However, this is just the beginning. Policies announced since 2020 indicate that governments around the world are prepared to hand the fossil fuel industry as much as $200 billion in grants and tax credits. Many of the countries financing this build-out of dangerous distractions with taxpayer money are also planning huge growth in oil and gas production.
As many of these governments begin to phase out other fossil fuel subsidies to meet international and domestic commitments, new funds and tax breaks for CCS are being introduced in their place. These new funds also act as fossil fuel subsidies and directly undermine progress from ending other support measures.
This chart shows the grants and tax credits we have tracked that have already been spent.
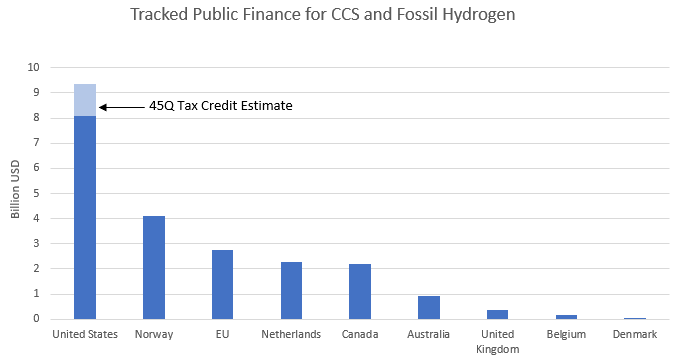
Source: Oil Change International (industry and government sources)
This table shows the range of potential government expenditures announced since 2020. Estimates largely differ due to uncertainties in potential tax credit claims. For example, the 45Q CCS tax credit expansion passed in the Inflation Reduction Act was uncapped—estimates of its potential impact range from $32 billion to $100 billion.
Table: Estimated value of policies announced since 2020 to support CCS and Hydrogen
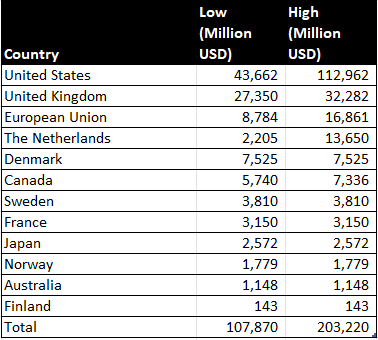
Source: Oil Change International (industry and government sources)
OCI’s subsidies database and methodology
OCI Database
Oil Change International (OCI) has compiled a database of carbon capture, fossil hydrogen projects, and the domestic taxpayer money they have received. The database draws on government and industry data to provide insights into both the history and current development trajectory of carbon capture and fossil hydrogen and the public money projects have received and may receive in the future.
So far, OCI has tracked government loans and grants to projects in every country where data is available, including Australia, Bahrain, Belgium, Canada, Denmark, the European Union, the Netherlands, Norway, the United Kingdom, and the United States.
What’s Missing
Governments likely spend much more than our research has been able to track, as there is also a shocking lack of transparency around tax credits, government-backed loans and guarantees, and other forms of support.
For example, the U.S. 45Q carbon capture tax credit is estimated to have cost taxpayers $1.3 billion through 2022. Joe Biden’s Inflation Reduction Act potentially allows companies to claim $100 billion more taxpayer money in credits in the next decade. Some countries (like China and Japan) do not disclose any information.
Carbon Capture Serves Oil and Gas Production
A Majority of Carbon Capture Projects Serve To Produce More Oil and Gas, Not Reduce Emissions
Data from our project’s database and analysis from leading experts such as IEEFA and others show that the majority of carbon capture (CCS) projects exist only to enable oil and gas production and fail to reduce overall emissions.
Key facts
- 79% of operating carbon capture capacity globally sends captured CO2 to produce more oil (via Enhanced Oil Recovery)
- 67% of operating carbon capture capacity globally captures emissions from processing CO2-rich gas.
Read our full analysis.
The vast majority of existing CCS capacity is not used to sequester CO2 permanently underground but instead to stimulate oil production in aging oil wells. This is called Enhanced Oil Recovery (EOR). According to our data, 79% of the global carbon capture capacity sends captured CO2 to an EOR project.
Pumping CO2 into old oil wells increases pressure and provides lubrication to send oil to the surface that would otherwise be left in the ground. There are serious questions about how much of the CO2 stays underground after it is pumped into old oil wells and about what the net emissions reduction results are given the addition of oil supply.
Global CO2 Capture Capacity by CO2 Destination
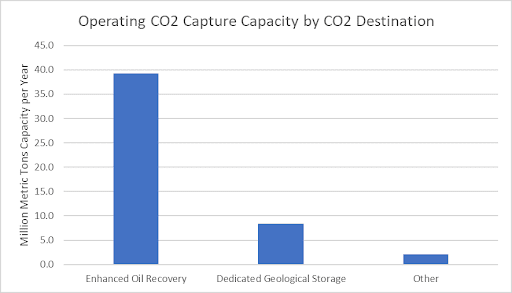
Source: Oil Change International (industry and government sources)
Gas Processing is the leading source of CO2 captured today
The majority of CO2 being captured today is not captured from power plants or industrial processes like steel or cement, which is how CCS is often marketed. Instead, 67% of CO2 captured today comes from gas processing plants.
These fossil-fuel production plants separate gasses extracted from oil and gas wells. CO2 is often one of the gasses present in oil and gas reservoirs and must be separated to produce marketable gas. Some reservoirs are particularly CO2-rich, and the high concentration of CO2 in these streams makes it more viable to capture the CO2 rather than vent it into the atmosphere. This is the lowest-hanging fruit for carbon capture because the operation is already required to separate the CO2.
Global Operating Carbon Capture Capacity by CO2 Source
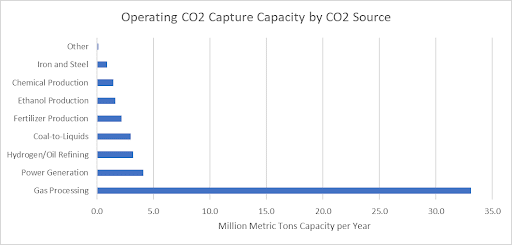
Source: Oil Change International (industry and government sources)
Producing More Oil: The Main Use of Captured CO2
As a means to reduce emissions, the CCS business model is fundamentally flawed. Projects that send captured CO2 to produce more oil (through Enhanced Oil Recovery) often greatly underperform their stated capture capacity due to the incompatibility between the EOR project’s demand for CO2 and how much CO2 is produced at the capture facility. CO2 produced in excess of what the EOR project will pay for is often vented into the atmosphere. A report from the Institute for Energy Economics and Financial Analysis (IEEFA) labeled this a “sell or vent” model.
To achieve globally agreed climate goals, fossil fuels must be phased out. Most CCS projects operating today do not reliably or permanently reduce emissions. Instead, they capture CO2 from fossil fuel production and use it to produce more fossil fuels. CCS instead provides a lifeline to fossil fuel companies, which are under pressure to phase out and are using CCS as a distraction to maintain their profits. Fatih Birol, the Executive Director of the IEA, warns we have to be careful that “CCS is not used as an excuse for large-scale fossil fuel investment.” So far, that is exactly what is happening.
Case Studies — (E)Mission Failure
Many of the largest CCS projects in the world overpromise and under-deliver, operating far below capacity.
An analysis by OCI of six of the leading CCS plants in the US, Australia, and the Middle East reveals that they are all either operating significantly below capacity, ranging from an estimated 10 to 60% capacity, or are designed only to capture a fraction of the emissions produced by the facilities they are attached to. In some cases, it is both.
Underperformance is the norm
Today, the total installed capacity of carbon capture projects operating worldwide is stated to be 49.7 million metric tonnes of CO2 per year. This is around 0.1% of global CO2 emissions. However, many projects operate substantially below capacity. The reasons for this are particular to each project. Some are constrained by the demand for CO2 at the oil projects that receive their captured CO2. What they cannot sell, they simply vent to the atmosphere.
Others have ongoing technical difficulties. In one case, the Al Reyadah plant in the UAE, the company has not disclosed detailed data on the project’s performance. However, our analysis finds that, even when operating at full capacity, it can only capture a small fraction of the emissions from the steel plant it serves.
Together, these case studies indicate that some of the biggest plants operating today are failing to demonstrate that CCS is a reliable means to reduce emissions.
Note: * Mt/Yr = Million Metric Tons per Year.
Al Reyadah/Emirates Steel, United Arab Emirates. Utilization rate: UNKNOWN
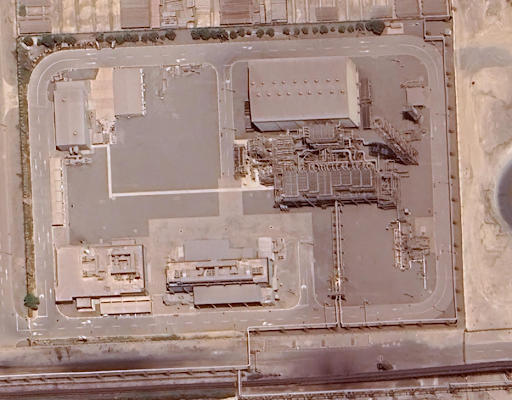
Image credit: Google Earth
- Stated Installed Capacity: 0.8Mt/Yr.*
- Utilization Rate: UNKNOWN. ADNOC does not disclose data on this plant’s performance. Emirates Steel Arkan, the company that runs the steel plant, does disclose some information about the plant’s emissions. From this information, OCI has calculated the following:
- Emirates Steel states that the CCS plant was designed to capture up to 45% of the total emissions of the first step in the steel production process, known as DRI (Direct Reduction Iron).
- An OCI analysis estimates that the CCS plant is designed to capture around 17% of the steel plant’s total CO2 emissions at full capacity.
- Direct electrification using solar and nuclear, implemented for the first time in 2022, has likely reduced emissions by twice as much as the CCS plant is designed to do.
- Company: Abu Dhabi National Oil Company (ADNOC) and Emirates Steel Arkan
- Year Started: 2016
- CO2 Source: Steel Production
- CO2 Destination: Enhanced Oil Recovery
- Touted as a model project for decarbonizing steel production, investigations by OCI reveal that Al Reyadah was designed to capture a mere fraction of the steel plant’s emissions.
- Al Reyadah means leadership in Arabic. But in seven years, no other steel plant has followed its lead.
- Months of inquiries and research have found only that ADNOC does not disclose detailed performance data. ADNOC repeatedly declined to answer detailed questions. However, some information is available in Emirates Steel Arkan presentations.
- In its November 2023 Investor Presentation, Emirates Steel Arkan acknowledged that it captures less than half (45%) of the CO2 emissions from its Direct Reduction Iron (DRI) plants, the first step in the steel-making process, after which the CO2 is siphoned off to the ADNOC CCS project.
- An analysis by OCI indicates the plant is only designed to capture between 17% of Scope 1 and 2 CO2 emissions from the full steel production process.
- In addition, this calculation does not consider the fact that the CCS plant generates 10% “parasitic” CO2. This refers to emissions from running the CO2 compressors and other carbon capture facilities. So, the maximum net CO2 reduction is 0.72 million tons per annum.
- In 2022, Emirates Arkan Steel stated that it had reduced the emissions intensity of the plant by sourcing electricity from nuclear and solar. This appears to have achieved double the emission reductions compared to the CCS plant’s designed capacity.
- It is also likely that the EOR operation limits both the amount of CO2 the plant was designed to capture and possibly the amount it actually captures.
- There were also teething problems. ADNOC officials admitted there were challenges with the decompressor. Oil industry and regional press outlets reported that by Jan. 2018, Al Reyadah had only captured 240,000 tons or about 25% of what it should have captured since starting up in November 2016.
- There are indications that it has rarely operated at full capacity. A 2022 sustainability report states that the steel plant’s parent company has been able to “decrease our total emissions (scope 1, 2 and 3) in our steel businesses by around 13% in comparison to 2021 due to an increase in carbon capture and a clean energy certificate.”
- In 2022, the World Economic Forum stated that the Emirates Steel plant was “operational at ~42% carbon capture efficiency.” We have been unable to verify this figure.
- Company representatives have discussed a plan to “recycle” CO2 that returns to the surface from the EOR operation. It is unclear if this is happening today. This suggests that a quantity of injected CO2 has returned to the surface and has been vented to the atmosphere. It also raises the question of whether less captured CO2 from the steel plant will be needed if “recycled” CO2 is reinjected. Meanwhile, CO2 is said to have increased oil production by 10%.
Key Sources: OCI analysis of published data, ADNOC and Emirates Steel Arkan documents and videos, and speaking to experts.
Al Reyadah Calculation Methodology
Assumptions are based on figures in the Emirates Steel Investor Presentation – November 2023. And Emirates Steel Arkan 2022 Annual Report)
Slide 14 of the November 2023 Investor Presentation states: Emirates Steel Arkan is the world’s first steel company to capture its CO2 emissions. Partnership with ADNOC allows us to accumulate up to 800 kt of CO2/year as part of Carbon Capture Utilization and Storage (CCUS). This way, around 45% of CO2 generated from Direct Reduction Plants is captured.
Our assumption is that 45% is based on 800kt/year. Therefore, the company’s own statement is that the CCS plant was designed to capture up to 45% of the total emissions of the DRI units.
However, the DRI units are not the only source of emissions at the plant. The total emissions of the steel plant and the percentage of the total that the CCS plant can capture are calculated as follows.
Slide 16 shows that in 2020, the total emissions factor of the plant was 1.1MtCO2 per ton of steel produced. This is assumed to be post-CCS, as the presentation notes that this emissions factor is 40-45% below global benchmarks.
The maximum steel output of the plant is 3.6 million tons per year.
Therefore, the total maximum emissions of the plant in 2020 prior to CCS was:
3.6 (steel tonnage) x 1.1 (emissions factor per ton of steel produced post-CCS) + 0.8 (CCS maximum) = 4.76 million tons per year.
Therefore, if operating at maximum capacity, the CCS plant could only capture 17% of the plant’s total emissions. I.e. 0.8 / 4.76 = 0.1681 (rounding up to 17%)
In 2021, the emissions factor is reported as 1.08. It is unclear what the difference is between 2020 and 2021. But in 2022, the company states on slide 15 that following a switch to solar and nuclear-derived electricity, emissions were reduced an additional 35% to 0.7MtCo2 per ton of steel produced.
This means that electrification with solar and nuclear power reduced the plant’s emissions (based on full production of 3.6 million tons per year) by 1.44 million tons per year. This is in addition to the CCS operation.
3.6 X 0.7= 2.52
3.6 X 1.1 = 3.96
3.96 – 2.52 = 1.44
The emissions reductions achieved by ‘clean’ electrification are 80% greater than with CCS. I.e. (1.44-0.8) / 0.8 = 80%
The above calculations may ignore the 10% parasitic emissions, which are the emissions from the fuel used to run the CCS capture facility and CO2 compression. This happens outside of the CCS plant but is part of the plant’s scope two emissions. With this factored in, the numbers are as follows.
10% parasitic = 80kt/year
Add this to the plant’s total emissions = 4.76 + 0.08 = 4.84. Note that it is unclear whether the parasitic emissions were calculated in the steel company’s emissions intensity factors used above. We are assuming that they were not given that these emissions happen at the CCS facility run by ADNOC. But it is possible that Emirates Steel Arkan’s emissions intensity factors (o.7-1.1) include these emissions.
This would mean the CCS reduced total emissions by only 16.5% (0.8 / 4.84)
And that total emissions reduction after parasitic is 0.72 Mt/yr
And that the electrification with nuclear and solar is twice as effective as CCS in reducing emissions at the plant.
(1.44-0.72) / 0.72 = 100%
The Century Plant, Texas, USA. Utilization rate: 10%
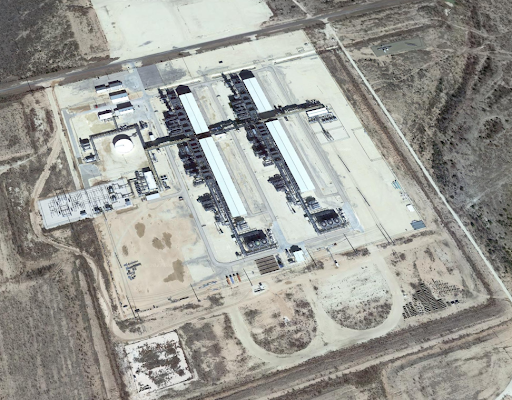
Image credit: Google Earth
- Capturing at 10% of operating capacity
- Stated Installed Capacity: 8.4Mt/Yr
- Performance: 0.8Mt/Yr
- Location: Texas, USA.
- Company: Mitchell Group (sold by Occidental Petroleum in 2022)
- Year Started: 2010
- CO2 Source: Gas Processing
- CO2 Destination: Enhanced Oil Recovery
- A recent Bloomberg investigation revealed that Century has never operated above a third of its capacity and struggled to reach even that. From 2018 to 2022, it captured less than 10% of its capacity. Over one-third of the installed capacity (3.4Mt/yr) is reportedly mothballed and not operational.
- The plant was designed to capture CO2 from processing very CO2-rich gas from the Pinon field in West Texas, sending the captured CO2 for oil production in the Permian Basin.
- It came online just as the US fracking boom took off. This cratered the wholesale price of gas in the US and meant this CO2-rich gas field couldn’t compete. Few wells were drilled, leading to the plant’s capacity going unused. Occidental quietly sold Century in 2022 for a fraction of the cost.
- Century’s 8.4 million tons per year capacity makes it the second-largest operating CCS project in the world on paper. Its very low utilization rate (%3C10%) and the fact that what is captured goes to EOR signals that installed capacity says little about the emissions reduction achieved by CCS projects.
Key sources: Bloomberg investigation, speaking to experts, EPA data
Shute Creek – LaBarge Gas Processing, Wyoming, USA. Utilization rate: 50%
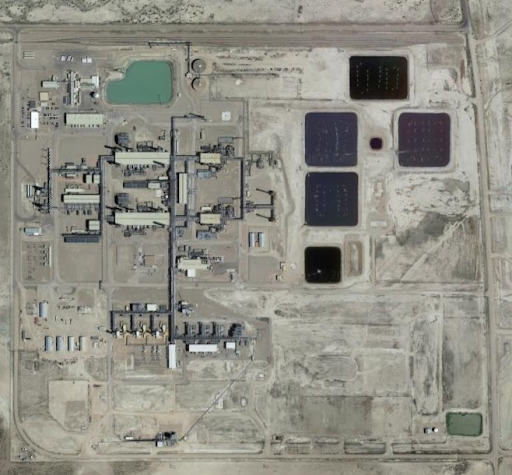
Image credit: Google Earth
- Capturing at 50% of operating capacity
- Stated Installed capacity: 7Mt/Yr
- Performance: 3.4Mt/Yr
- Location: Wyoming, USA.
- Company: ExxonMobil
- Year Started: 1986
- CO2 Source: Gas Processing
- CO2 Destination: Enhanced Oil Recovery
- Exxon promotes the plant as part of its emissions reduction strategy, but Shute Creek processes CO2-rich gas and sends the CO2 to various aging oil fields in Colorado and Wyoming to increase oil production.
- Plant operates a “Sell or Vent” business model, in which the CO2 that is not required for EOR is vented to the atmosphere rather than captured.
- Analysis from IEEFA finds that the CO2 demand for EOR fluctuates with the oil price, and over the lifetime of the project, 50% of its CO2 has been vented.
Key Sources: IEEFA, Exxon’s materials
Dakota Gas Great Plains Synfuels, North Dakota, USA. Utilization rate: 67%
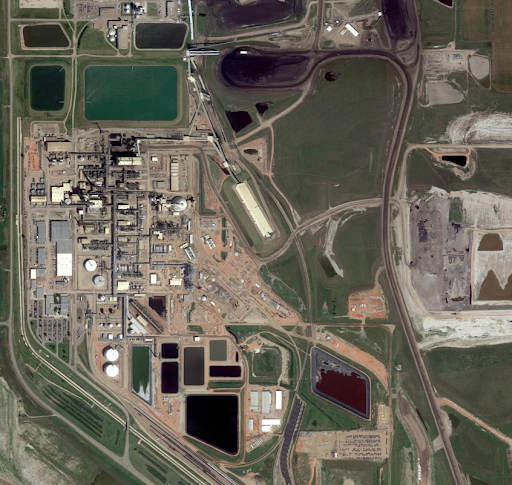
Image credit: Google Earth
- Capturing at 67% of operating capacity
- The plant did not capture CO2 for its first 16 years of operation, making lifetime performance only 37%.
- Stated Installed Capacity 3Mt/Yr (which is only 50% of the plant’s total emissions at full capacity)
- Location: North Dakota, USA.
- Company: Dakota Gas
- Year Started: 1984
- CO2 Source: Lignite Gasification
- CO2 Destination: Enhanced Oil Recovery
- The plant takes one of the dirtiest fossil fuels, lignite coal, and gasifies it to make fuel, fertilizer, and various chemical feedstocks.
Captured CO2 is sent to Canada for EOR, where it is expected to enable an additional 130 million barrels of oil to be extracted. - The plant started operations in 1984 with the help of a $1.5 billion loan from the Department of Energy.
- The plant did not capture any CO2 until 2000.
Key Sources: Company’s own materials; EPA data
Gorgon LNG, Barrow Island, Western Australia. Utilization rate: 40%
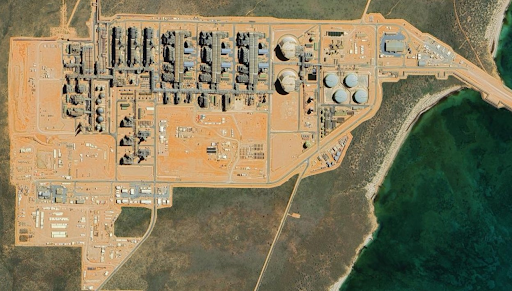
Image credit: Google Earth
- Capturing at around 40% operating capacity in the 2021-2022 fiscal year.
- Failed to inject any CO2 for first 3 years.
- Total injected CO2 reported as 7 million tons in October 2022
- This equates to a performance rate of 27% since the project’s start in 2016. (See below)
- Stated Capacity: 4Mt/Yr.
- Location: Barrow Island, Western Australia.
- Company: Chevron, Exxon, Shell
- Year Started: 2016
- CO2 Source: Gas Processing
- CO2 Destination: Geological Sequestration
- The project processes CO2-rich gas from an offshore field, which is then liquified for export.
- Gorgon is one of the few projects sending CO2 to geological storage rather than oil production.
- But problems with the injection of CO2 into the storage site have plagued it since day one.
- No CO2 was injected in the first three years of operation. So, all separated CO2 was vented.
- The Conservation Council of Western Australia described the project as “veer(ing) from shambolic to dangerous for years, largely without any meaningful punishment from the regulators.”
Key Sources: Chevron’s own materials, IEEFA, press reports, and OCI’s own calculations
Calculation: based on 7 million tons captured, which is 6.5 years of operation from March 2016 to October 2022. Stated Capacity of 4Mt = 26Mt. 7Mt is 27% of 26Mt.
Petra Nova, Texas, USA. Utilization rate: 58%
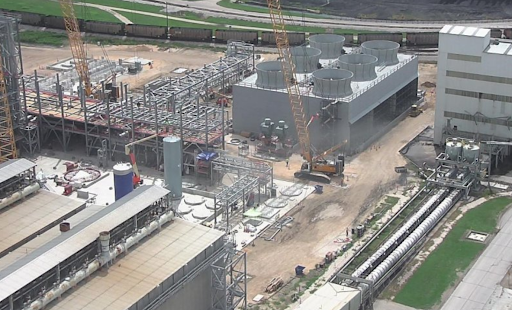
Image credit: Google Earth
- The percentage of net plant emissions captured was estimated at 55 to 58 of operating capacity in 2017-2020.
- The capture plant was mothballed in 2020 when oil prices crashed, and demand for CO2 for EOR tanked.
- Location: Near Houston, USA.
- Company: NRG then sold to JX Nippon
- Year Started: 2017
- CO2 Capture Capacity: 1.4M tonnes/Year
- CO2 Source: Coal-fired power generation
- CO2 Destination: Enhanced Oil Recovery
- The only coal plant in the U.S. that has captured CO2.
- The net capture rate is calculated at 55-58% when factoring in emissions from the gas-fired turbine running the capture and compression, the emissions from which are not captured.
- The plant was mothballed in May 2020 due to falling oil prices at the height of the pandemic, which “made the project economics challenging.”
- The CCS facility restarted in September 2023, months later than originally planned. JX Nippon, a Japanese energy company, is now the sole owner after buying NRG’s share last year.
Key Sources: Plant owner’s materials; Reuters; US Department of Energy; IEEFA