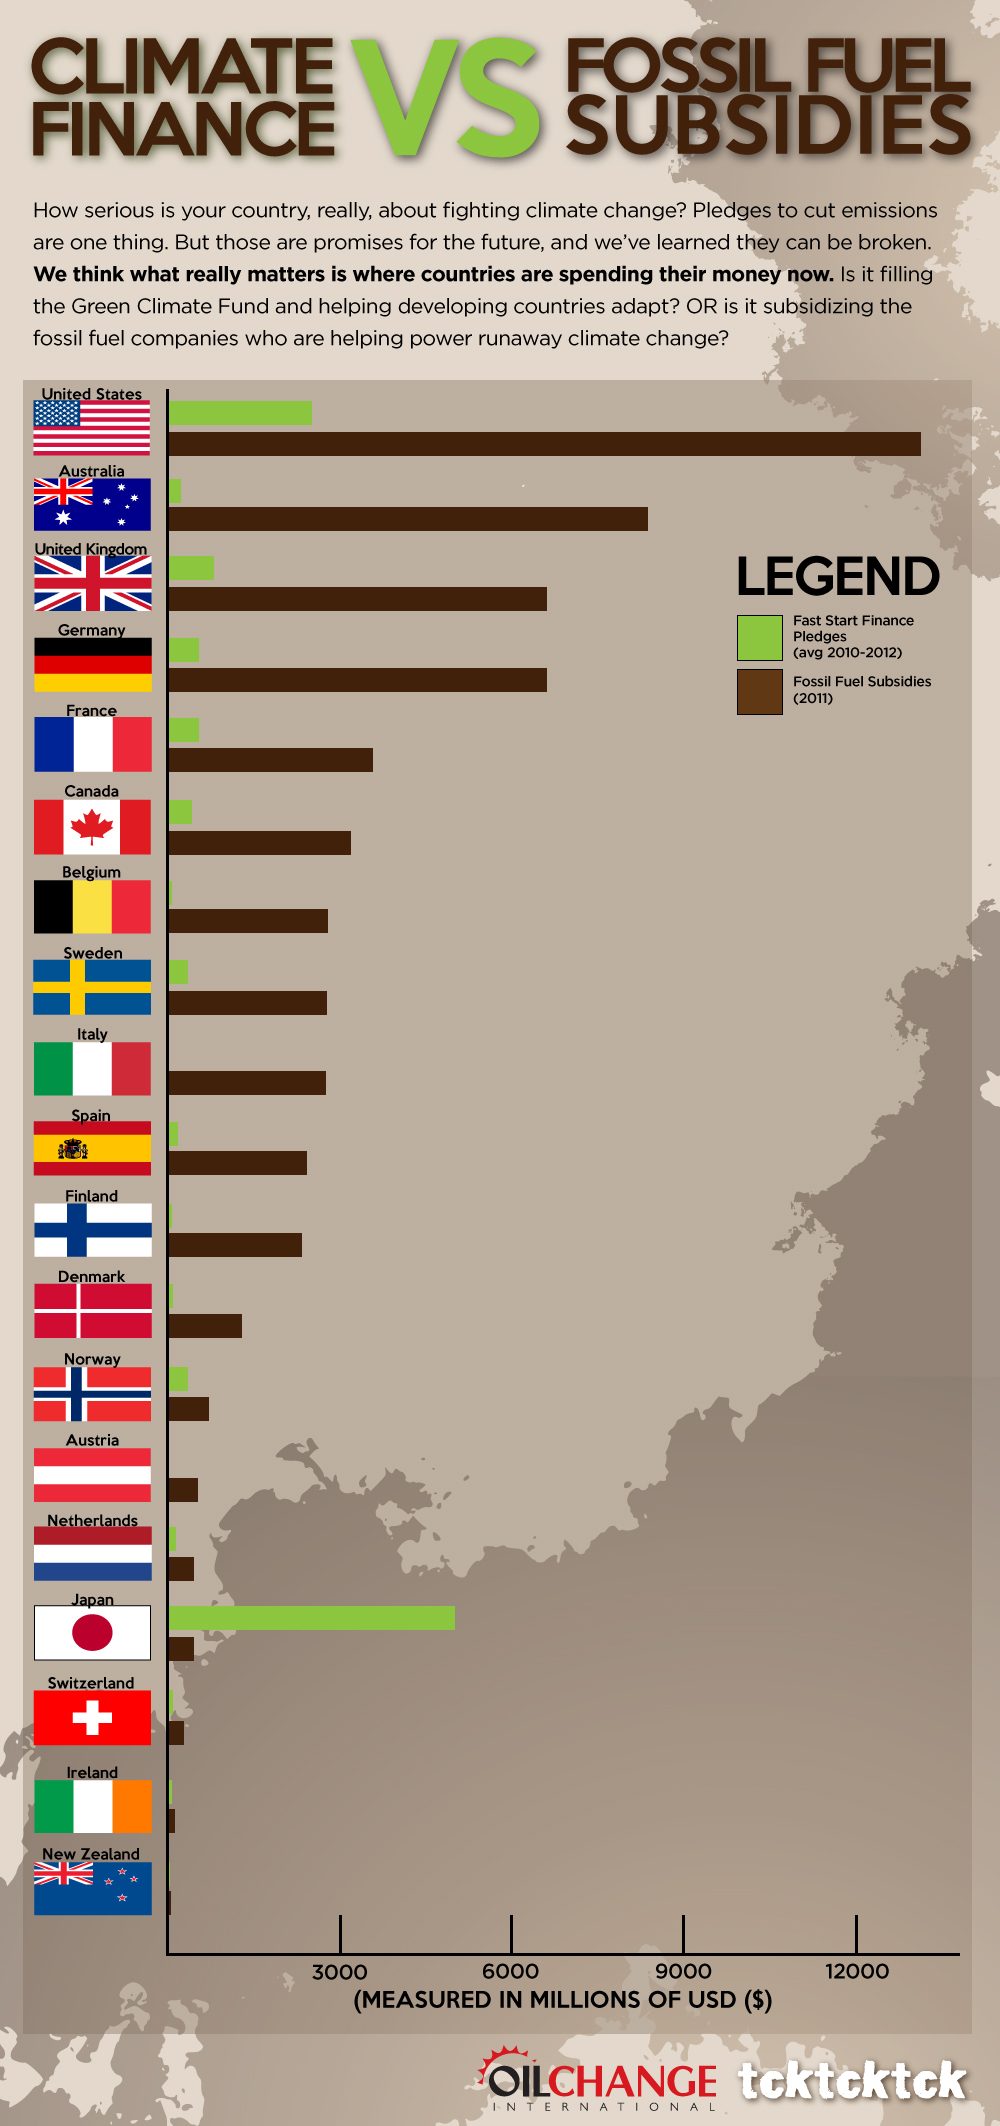
Here in Doha for the UN climate negotiations, we’ve just released new analysis that shows that fossil fuel subsidies in rich countries are, on average, five times greater than those same countries’ pledges towards climate finance (support to developing countries to address climate change and its impacts). Sometimes pictures speak louder than words, so here’s a graphic that lays it out:
For more information, see our more detailed two-pager here.


So apparently my country, Sweden, isn’t serious about climate change, because we subsidize the fossil fuel industry. Even though Sweden doesn’t actually _have_ any production of oil, coal or natural gas, nor electrical production from them. (and the OECD report says as much)
The ‘subsidy’ here is because certain industries (e.g. mass-transit) have reduced carbon taxes. Countries like Japan – who actually use much more oil and natural gas, but who didn’t have a carbon tax in 2011, naturally doesn’t have any ‘subsidies’ counted from reductions in a tax it didn’t have.
So apparently we’re doing less to fight climate change by having a carbon tax that’s not a _flat tax_ across all users, when compared to those with no carbon tax.
Sweden has no fossil fuel industry, has a carbon tax, has no significant electricity production from fossil fuels, and has reduced CO2 emissions significantly since 1990. Japan has increased emissions since 1990, only instituted a carbon tax this year (so, not in the stats), and is a major consumer of natural gas.
And yet, you’re implying Sweden supports the fossil fuel industry more than Japan does??
The comment from the Swede (Dec 5, 2012 @ 1:04am) is much more factual & true – no bias or bullshit as in the table, which is very misleading and misinforms.
I would ask every individual “what are you yourself doing about climate change ? ” – Yes when you point your finger at your neighbour there are ALWAYS 3 FINGERS pointing back at YOU, YOU, YOU !! Our award winning energy efficient house built in 1998 was named ” A SHINING EXAMPLE” in a full 2 page spread in Sydney’s weekend newspapers at the time of our 2000 Olympics – It was our small way of helping the planet – EVERYONE SHOULD DO IT, you just can’t wait for governments !!
Would like to know how this breaks down, and hope there is a good explanation.
would like to see how and from what data this was compiled.
LMA
Being Danish I’m shocked, I would like to see how this breaks down. What data this is compiled from.
Svenne is right that this graph doesn’t show which country is furthest ahead in the energy transition to a low/no carbon economy.
Not surprising: those countries that are trying to put a price on carbon are usually also doing it in a way that they protect their own energy-intensive industry. By essentially not making them pay the carbon price. They have to do this, or they would lose their industry .. it would move to the countries without a price on carbon.
A possible alternative would be to introduce carbon tariffs. But even then the energy-intensive industry would have great difficulty being competitive when exporting to countries without a carbon price. You could still argue for subsidies to level the playing field. Of course all of that is not allowed by the WTO. But apparently it is ok not pricing co2 at all, or exempting these companies from carbon price.
Folks, this chart is accurate for the kind of data it is comparing, namely the green bar shows “fast-start” pledge funds to other, developing countries, per the Copenhagen and Cancun agreements. See the fifth sentence in the chart description (and the qualifier in parentheses in the opening sentence at the very top), and see this site: http://www.wri.org/publication/summary-of-developed-country-fast-start-climate-finance-pledges.
BUT, it does NOT show investment in domestic projects to reduce emissions or transition away from carbon-based energy. Therefore, it is definitely correct that the chart is VERY misleading, because the opening sentences of the chart description, especially the sentence in bold, talk about investment in making a transition, which implies all forms of spending (domestic AND international aid) whereas the data does NOT reflect all forms of spending, i.e. does NOT include domestic spending, such as what is going on in Sweden.
Shame on the folks presenting this data for being so misleading.
Till Svenne:
Det må vara sant att Sverige inte har någon inhemsk fossilbränsleindustri. Men det ändrar inte på det faktum att vi (effektivt sett) häller en massa skattepengar i fickorna på fossilbränsleindustrin genom att subventionera energiintensiva näringar på det sätt vi gör. Därmed bär vi ekonomiskt och politiskt sett precis lika stor skuld till problemet som de industrinationer som själva producerar.
Att ”göra någonting åt klimatkrisen” (på riktigt) innebär inte bara att minska emissioner, vilket Sverige gör (i alldeles för långsam takt). Att agera moraliskt och ansvarsfullt i klimatfrågan är att erkänna att den industrialiserade världen för det första historiskt sett givetvis bär den största skulden till problemet, men även i nuläget fortfarande emitterar mest (mätt per capita) och som en följd därav avsätter erforderliga finansiella resurser för att hjälpa våra offer (i tredje världen) att hantera konsekvenserna av klimatförändringarna samt att snarast ställa om sina samhällen till hållbara system. I detta avseende är (som framgår av tabellen) Sveriges agerande skandalöst uselt.
Vi svenskar har verkligen ingenting att slå oss för bröstet om i denna fråga.
I övrigt instämmer jag helt i kritiken mot Japan och liknande länder.