
As climate action gains momentum, there is a growing call for proposed fossil fuel infrastructure and policies to be measured in terms of their role in a safe climate future — in other words, a climate test. But what should they be tested against? Unfortunately, the most widely used “climate scenario” in energy models — the International Energy Agency’s (IEA) 450 Scenario — falls well short of giving us a good chance at a climate-safe pathway.
Carbon Budgets
The question of what makes a safer climate scenario is not purely a scientific one. The science tells us how much can be emitted in total for a given probability of staying below a given temperature limit (an overall carbon budget), but not how that breaks down between oil, gas, and coal, nor between countries, nor over time.
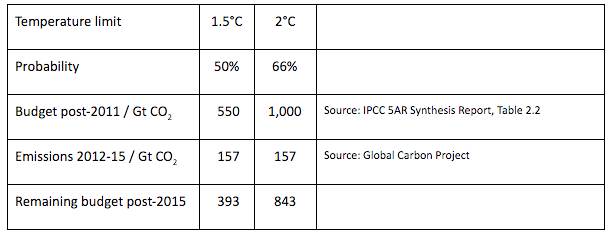
Let’s start with the size of the budgets, as calculated by the Intergovernmental Panel on Climate Change (IPCC). To have a 50-50 chance of staying below the 1.5°C limit agreed last December in Paris, the carbon budget would be used up by 2026 at current rates. If we accepted the weaker goal of staying below 2°C (with a 2-in-3 chance), at current emissions rates the remaining carbon budget would be exhausted in 2037. [1]
Overshooting 2°C of Warming
The only official mapping of future energy systems in a climate-constrained world – projecting oil, gas, and coal flows over time – is the IEA’s 450 Scenario (450S). By comparison with business-as-usual scenarios – such as the U.S. Energy Information Administration’s (EIA) Reference Case — the 450S shows reduced fossil fuel emissions. But that does not mean it is adequate. And although the IEA claims this scenario is consistent with the 2°C limit, there are two problems with this.
The first problem is that the IEA’s stated atmospheric CO2 target of 450 parts per million (ppm) gives only a 50% probability of staying below 2°C. In recent years, scientific evidence has indicated that severe impacts will begin to kick in at 2°C of warming. A scientific review within the UNFCCC concluded in 2015 that 2°C should not be seen as a “safe” target, but rather as “a defence line that needs to be stringently defended, while less warming would be preferable.” 50-50 odds hardly constitute stringent defence.
Second, even for that questionably safe target, the IEA assumes “overshoot”, with atmospheric concentrations actually reaching higher levels than 450ppm, then somehow falling back at some later date. The IEA does not explain what pathway it expects emissions to follow after its modelling period to 2040, and declined to respond to enquiries, but comparison of its emissions pathway with the IPCC’s carbon budget for a 50-50 chance of staying below 2°C shows a striking gap (chart below).
Chart: World Emissions (Gt): IEA Scenarios Compared to 50% Chance of 2°C
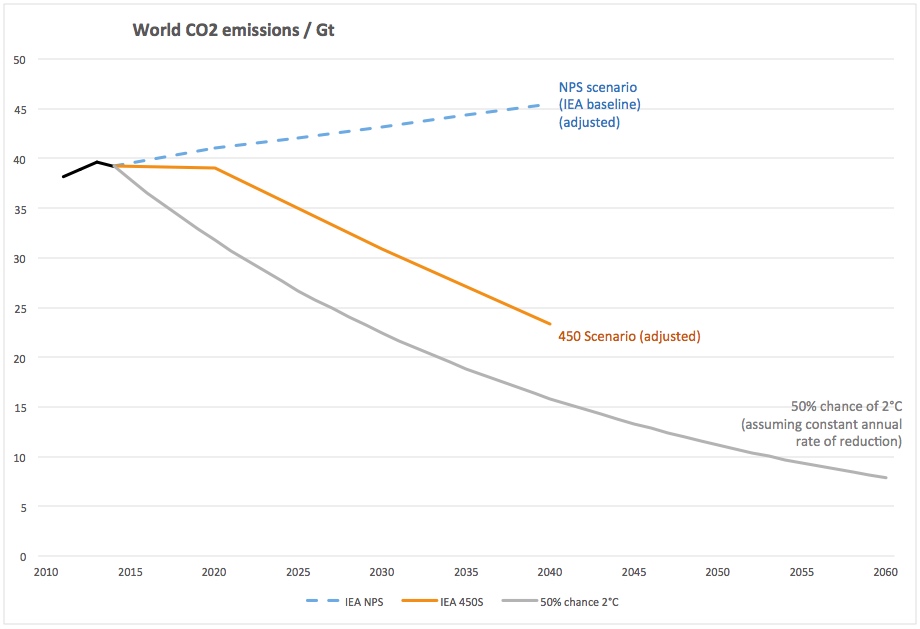
Sources: IEA World Energy Outlook, IPCC 5AR SYR, GCP [2]
At best, the IEA assumes that climate action will happen later rather than sooner; at worst it relies on hypothetical and distracting “negative emissions” technologies becoming available in the second half of this century. Either approach is reckless, to say the least, given the consequences of exceeding climate limits.
Good News for Oil Companies
As a result, the 450S calls for relatively modest change in the energy industry: a reduction of just 18% for oil and 38% for coal between 2013 to 2040. Gas would actually increase by 16%. This creates a dangerous complacency that serious action is not required.
Oil companies’ energy forecasts assert that even the level of emissions reductions in 450S are very unlikely to be achieved. Nonetheless, under pressure from investors, BP and Shell have been forced to review their portfolios’ resilience to climate action. In response, BP points out the large markets for oil and gas in the 450S, and Shell says it would actually benefit from the 450S projections.
Real Climate Limits
So what might a genuinely climate-safe scenario look like? A simplified approach is to apply the carbon budgets equally to the three fossil fuels at a global level. This gives a guideline for how production of each fuel must decline (with greater production of a given fuel possible only if deeper cuts have been made in at least one of the other fuels).
Chart: Global Oil Production (mbd): IEA Scenarios Compared to Carbon Budgets

Sources: IEA World Energy Outlook, IPCC 5AR SYR, GCP
Over the coming months, OCI will explore the principles by which carbon budgets may be allocated, including how they apply to oil, gas or coal, and to different countries.
What Next?
It is clear from the chart above that fossil fuel extraction must be decreased, starting immediately.
Governments applying a climate test should demand models of energy markets that genuinely align with climate goals, including the 1.5°C temperature limit. As well as instructing their own energy analysis agencies, governments of member countries should request the IEA conduct analyses of possible energy futures more consistent with their climate goals.
Investors scrutinizing oil companies’ portfolios should likewise not allow themselves to be fobbed off with mentions of the 450S. They should probe the viability of oil and gas assets in scenarios that actually align with international commitments.
It is welcome that the IEA sees part of its role as informing decision-makers on the climate/energy challenge. But if it continues to temper this with too much conservatism, it risks losing its relevance in climate debates.
I used to work in a related field for the Australian Government, and a surprisingly common misunderstanding I found amongst many players, such as policy makers, climate action advocates, the media, industry and some in the IEA itself, was their misunderstanding of how 450ppm is actually defined.
As far as the IEA goes (or went), 450ppm actually means 450ppm of CO2-eq (CO2 equivalent), and not simply CO2 (see the IEA’s World Energy Outlook 2012 p.446 for their definition. I can email a scan of this page if needed). Other agencies such as the European Environment Agency also define it as CO2-eq.
In addition to CO2, CO2-eq includes the other greenhouse gasses, which also contribute to global warming and climate change, and should therefore also be into account.
There is a very significant difference between CO2 and CO2-eq. The world went through 450ppm CO2-eq several years ago (it was around 489ppm CO2-eq at the end of 2016), but policy makers and others keep on talking about keeping below 450ppm.
I wish more people would notice this basic and important fact, and address it accordingly when talking about 450 scenarios, 450ppm etc.